
Stop Grading Setups By Eye.Your Chart Prints The Score.
Works on ANY Symbol, in nearly EVERY Timeframe.Stocks, futures, forex, crypto, indices, commodities. Seconds to monthly.
CSI Pro scores the bull case and the bear case out of 100 on every bar, then stamps the verdict on the candle itself: HIGH, MEDIUM, or nothing at all. You read one rating instead of refereeing six opinions.
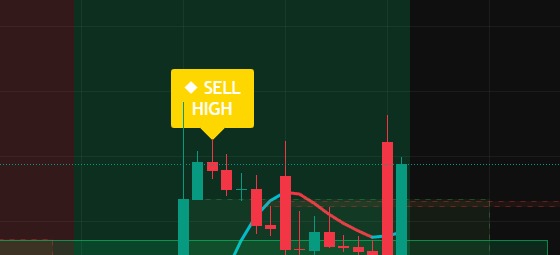
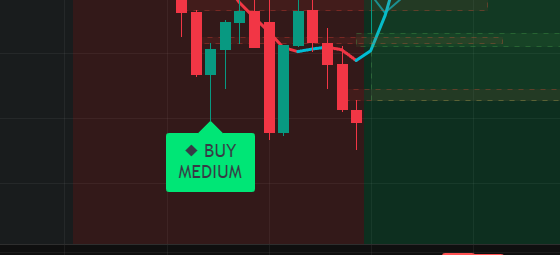
- The rating rides on the label. ◆ BUY prints below the bar, ◆ SELL above it, with the tier on the second line.
- The number behind the rating is on your chart, so you can check the verdict yourself on any bar instead of taking it on faith.
- Labels wait for the candle to close. Require Bar Close ships switched on.
- Weak reads stay hidden by default, so a quiet market hands you an empty chart instead of noise.
- Two indicators land in your TradingView® account, and the free Basic plan is enough to run them.
One payment. No subscriptions. No renewal date. Nothing to cancel.
 Invite-only Pine Script™ v6 · two indicators

Risk disclosure: CSI Pro is a technical-analysis indicator for TradingView®, not a trade-recommendation service and not financial advice. Trading involves substantial risk of loss. Past performance is not indicative of future results. Results are not guaranteed and vary by individual.
The Indicator, Loaded On A Live Chart
No slideshow. The panel, the labels, and what prints as each bar closes.
Real TradingView® chart, historical data. Recorded to show what the indicator prints. Not a performance record.
Ten Indicators. Ten Readings. Zero Verdicts.
We were not short of tools. We were short of arithmetic. RSI said oversold. The moving averages were tangled. Volume looked uncertain. Every one of them was right about its own small question, and not one of them would tell us whether the setup in front of us was worth taking.
So we stopped adding indicators and started scoring them. CSI Pro weighs twelve pieces of evidence for the bull case and the same twelve for the bear case, on every bar, and turns each side into one number from 0 to 100.
Then it prints the verdict where you are already looking: on the candle. 65 or better is HIGH. 45 or better is MEDIUM. Below 45 is LOW, and LOW is hidden unless you switch it on. Both cut-offs are settings. Move them and every rating on your chart moves with you.
Your Charts Are Fighting Against You
And while you are still deciding which one to believe, the move is already gone.
Conflicting readings
Five indicators on the chart, maybe ten. Half say one thing, half say the opposite, and you are supposed to reach a decision from that.
Setup quality is a mystery
An arrow appears. Fine. Is it a strong one, a weak one, or a trap? Most tools never tell you how much evidence is standing behind the mark.
Marks that move after the fact
A perfect entry marker appears mid-candle. An hour later it has shifted or vanished. Anything you learned from that chart was learned from fiction.
Every addition makes it worse
More lines, more conflict, more time spent refereeing. You spend the morning analyzing and miss the setup you were waiting for.
The higher timeframe finds you late
The 15-minute looks clean. The 4-hour is running the other way. Without an alignment check you learn that after you are already in.
No permission to sit still
Almost every indicator on the shelf is built to show you more entries. Almost none of them are built to tell you that today is not worth trading.
And if you are thinking "I have bought indicators before and they did not work," that is fair. Most fail for three reasons. They mark an entry without telling you how much evidence is behind it. They move the mark after the candle prints, which turns everything you tested into fiction. And they ignore the higher timeframe completely. The rest of this page shows you exactly how CSI Pro answers all three, and exactly where it stops.
Exactly What Prints On Your Chart
One real NVDA five-minute chart. Two labels, one data panel. Here is the entire vocabulary.

- HIGH
- Gold label. The side scored 65 or better out of 100.
- MEDIUM
- Green under a BUY, red over a SELL. The side scored 45 to 64.
- LOW
- Under 45. Hidden by default so it never clutters the chart.
- DUAL CONF
- Aqua under a BUY, magenta over a SELL. Two separate parts of the engine turned on the same bar.
- TRIPLE CONF
- White. The rarest tier. Three separate parts lined up at once.
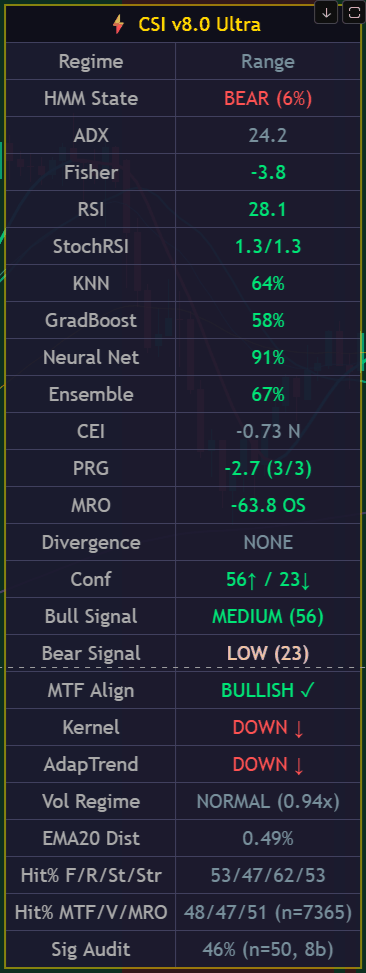
The panel is the receipt. Twenty-six rows, on the chart, on the most recent bar: the regime, every model read, both confidence scores, higher-timeframe alignment, the volatility regime, trend direction and two rows of running hit-rates.
Two tiers are not scored, they are earned. DUAL CONF and TRIPLE CONF do not come from the 0 to 100 number. They land when separate mechanisms agree inside the same bar, which is why they are rare and why they print white and aqua instead of gold.
10:15 a.m., the same chart. It is arguing with itself. RSI reads 28.1, washed out. ADX reads 24.2, so there is no strong trend to lean on, and the regime row just says Range. Two respected readings, two different answers, about a minute to decide.
The panel already did the arithmetic. Higher-timeframe alignment: BULLISH. Conf: 56↑ / 23↓. Fifty-six clears the 45 line and falls short of the 65 line, so the bull case rates MEDIUM, not HIGH, and the chart says so out loud before you commit to anything.
Every readout above is taken from the NVDA chart shown here, at the default 65 and 45 cut-offs. It illustrates how the panel works. It is not a trading outcome and the rating is not a probability of profit.
You have now read the whole chart language.
See what you get, and what it costs →What Actually Goes Into The Score
Every bar is scored from a fixed set of weighted contributions. Momentum, trend, market structure, volatility regime, higher-timeframe agreement, volume behavior and a blended read from the four AI models each carry a set share, and those shares do not move around from chart to chart.
Here is the part most vendors would rather bury: the AI blend is one weighted contribution among many, not the score itself. The larger share of every rating comes from classical technical analysis. The models are not an oracle you are asked to trust. They are one voice in a weighted vote, and the panel on your chart shows you every voice separately so you can see when they disagree instead of guessing at it.
The exact weights, the model parameters and the scoring math are proprietary and are not published.
Seven Things A Standard Indicator Will Not Do For You
A rating rule you can read, and move
The whole reason, on the chart
The label waits for the candle
The higher timeframe does not peek
It widens its own thresholds
Permission to wait
Two indicators, not one
CSI Pro On Real TradingView® Charts
Unedited screenshots on historical data. We have no customer testimonials to show you yet, so we are showing you the chart instead, including the bar where it declined to print anything.
The Score, Live On ScreenAnd what it looks like when nothing qualifies
Tesla, two-minute bars. A red SELL MEDIUM printed back when the bear case cleared the 45 line. Look at the panel now, on the last bar: Conf 3↑ / 32↓. Thirty-two is under the line, so nothing new prints. The volatility regime row reads HIGH at 1.37 times normal, which is exactly when the thresholds widen.

Four Model Reads, On The ChartNothing fires from a black box
NASDAQ 100 futures, two-minute bars. All four model reads, each on its own row, with their current percentages. Each model's current read sits in its own row, so when they split you can see the split instead of guessing at it. Conf reads 27↑ / 11↓: both sides under 45, both rated LOW, and higher-timeframe alignment reads MIXED.

Order Blocks And Fair Value GapsSwitched on for this screenshot, and off when you install it
Bitcoin, daily bars, with the gold SELL HIGH and green BUY MEDIUM labels on the same chart. Green boxes mark demand, red boxes mark supply, dashed boxes mark the price gaps, and the background shades itself by regime. Be clear on this one: order blocks, fair value gaps and structure-break triangles all ship switched OFF. They are three checkboxes in the settings, and this screenshot has them on.

Any symbol you can chart. The Gold futures four-hour chart at the top of this page, Tesla on two minutes, NVDA on five, NASDAQ 100 futures on two, Bitcoin on the day. Same engine, same 0 to 100 scoring, same five label tiers, whatever you put in the symbol box. One caveat we would rather you hear from us: on a feed that carries no volume data, two of the contributions go dark, and a score on that chart can no longer reach 100.
What CSI Pro Will Not Do
This section costs us sales and we keep it anyway. If any of it is a dealbreaker, we would rather you found out here than after checkout.
It will not trade for you
Both scripts are indicators, not strategies. CSI Pro places no orders, sets no stops and sizes nothing. Every decision, and every consequence, stays yours.
There is no backtest report, and we will not fake one
An indicator cannot be run through TradingView's Strategy Tester, so no equity curve exists for us to publish. Anyone showing you one for a tool like this built it somewhere else, under assumptions you cannot inspect.
The rating is not a win rate
A score of 72 means a lot of the evidence agrees on direction on that bar. It is not a 72 percent chance of profit, and no setting inside the indicator turns it into one.
The Confluence Pane does not wait for the bar
The chart overlay does, by default. The second indicator does not: its markers and its alerts evaluate while the candle is still forming and can change before it closes. If you alert from the pane, set the TradingView alert to fire on bar close.
It needs real history before it wakes up
The longest average wants roughly 200 bars, the nearest-neighbor engine needs a good stretch of its own before it has anything to compare against, and the adaptive weights sit out until they have enough resolved observations to grade. On a thin chart you are not seeing the whole machine.
Old labels do get removed
A closed label never moves or changes tier. But the chart keeps the 50 most recent and deletes the oldest beyond that, and a lower tier is cleared away when a higher tier supersedes it within three bars. Scroll far enough back and the early ones are gone.
We cannot tell you how often it prints
It is deliberately selective, and how selective depends on your symbol, your timeframe and your thresholds. We have not measured a labels-per-day figure, so we are not going to quote you one. Load it on your own chart and count.
It is not a substitute for knowing how to trade
CSI Pro adds a scored, objective read on top of a process you already have. If you do not yet have a process, build that first. This is an analysis tool, and the score is only as useful as the risk management underneath it.
What Lands In Your Account
Two invite-only indicators, delivered to your TradingView® username. All future updates included.
The indicators
- The chart overlay that prints the rated BUY and SELL labels, plus the DUAL and TRIPLE confluence tiers
- The Confluence Pane, a separate oscillator running the CEI exhaustion and PRG reversal gauges with their own markers
- The live 26-row data panel, updated on the most recent bar
- 24 built-in alert conditions across both indicators, including HIGH-rated BUY and SELL
- Order blocks, fair value gaps and structure-break marks, off by default and one checkbox away
Access and control
- Invite-only Pine Script™ delivered straight to your TradingView® account
- The free TradingView Basic plan is enough. Paid plans work too, and you never have to upgrade
- You claim it yourself in Whop right after checkout. Minutes, not days
- 104 adjustable inputs on the overlay and 31 on the pane, including both rating cut-offs and the higher-timeframe pairings
- Or change nothing at all, because the shipped defaults are the recommended setup
Documentation and support
- The complete browser-based owner's manual, written for the shipping build
- A Quick Installation Guide for TradingView®
- Human help by email, plus setup guides on the Support Hub
- Every future CSI Pro update at no extra cost
Who it is for
- You already read charts and manage risk, and you want an objective score layered on top
- You would rather take a handful of well-evidenced setups than chase every arrow on a chart
- You want the same rule applied to every market and every timeframe, so your process stops moving with your mood
- You execute on NinjaTrader, thinkorswim or your broker's platform, and use TradingView® as the analysis screen
Your Questions, Answered Honestly
No. CSI Pro runs on the free TradingView® Basic plan as well as paid plans. You only need a logged-in TradingView® account we can grant invite-only access to. If you do not already have one, sign up free at tradingview.com first, then complete checkout.
The chart overlay is, in its default mode, and the pane is not. On the overlay, Require Bar Close ships switched on, so a label is placed only after the candle closes and then keeps its position and its tier. Version 8 also reads the higher timeframes without looking ahead, in realtime as well as on history, which is why historical labels sit differently than they did in version 7. The Confluence Pane is the exception and we would rather say it plainly: it has no bar-close setting, so its markers and its alerts evaluate mid-candle and can change before the bar closes. If you alert from the pane, set the TradingView® alert to fire on bar close.
You keep it. One payment, every future update included, with 5+ years of support and updates ahead of it. That is the standard we build to. There is no renewal date to miss and no card on file to expire, so nothing can quietly switch itself off behind you.
No. One payment covers both indicators, the manual, the Quick Installation Guide, human help by email and every future update. No subscription, no renewal date, no card kept on file, nothing to cancel. The only other thing you could spend money on is TradingView® itself, and you do not have to, because CSI Pro runs on the free Basic plan.
It is a score out of 100 measuring how much of the evidence agrees on direction, and both sides are scored separately. The rule is arithmetic: 65 or better is HIGH, 45 or better is MEDIUM, below that is LOW, and both cut-offs are settings you can move. Both numbers sit on the chart panel so you can verify the rating yourself on any bar. It is not a win rate and not a probability of profit. A HIGH rating means more of the analysis lines up, not that you hold an advantage in dollars, and all trading carries risk regardless of the rating.
Less than you would guess, and that is deliberate. The four models blend into one weighted contribution, and the larger share of every rating comes from classical technical analysis. The exact weights are proprietary, but the panel on your chart shows each model's current read in its own row, so you can always see what the AI is saying and how much the rest of the engine agrees. The methods are real machine learning, and one of them genuinely learns from the chart you have open. They are not, however, four independent witnesses, because they draw on overlapping readings of the same chart. We would rather tell you that than let the word AI do work it has not earned.
Yes. Access is tied to your TradingView® account, not to a machine, so you can sign in from your desk, your laptop or your phone and CSI Pro is on the chart. What you cannot do is share it. Access is personal to your TradingView® username and cannot be transferred to another account.
No, and there is nothing to download. TradingView® serves the current build to your account automatically, so an update simply appears on your charts. If your panel still shows an older title, remove CSI Pro from the chart and add it again from Indicators → Invite-Only. That is the whole upgrade procedure.
Anything you can chart on TradingView®: stocks, futures, forex, crypto, indices and commodities, on any timeframe from one-minute scalping to daily swing setups. The same engine, the same 0 to 100 scoring and the same label tiers apply everywhere. Two honest caveats. On a data feed that carries no volume, two of the contributions go dark and the score on that chart can no longer reach 100. And it needs a few hundred bars of history before the full engine is awake, so a very thin chart will show you less than the tool can do.
It does the scoring. You do the trading. CSI Pro weighs the evidence on every bar, prints the score and the rating on your chart, and stops there. It places no orders, sets no stops and sizes nothing, and nothing on your chart is a recommendation to buy or sell anything. As with any analysis tool, what happens next depends on market conditions, your risk management and your own skill. Trade only with capital you can afford to lose.
Within minutes, and you claim it yourself right after checkout. Open the product in your Whop dashboard, enter your exact TradingView® username, click Set, then Claim Indicators. CSI Pro appears in TradingView® under Indicators → Invite-Only. Your welcome email walks through the same three steps. If anything sticks, email support@frontieralgo.com with your TradingView® username and your Whop order ID. Your purchase is processed securely through Whop®, our Merchant of Record.
You get your money back. Email support@frontieralgo.com before you do anything else. Most install problems come down to a mistyped TradingView® username and take about two minutes to sort out. If we still cannot deliver access to CSI Pro on your TradingView® account, we refund you in full. Support is human help by email. Trading results are a different matter. Nobody can promise those, so we do not.
One Payment. No Subscriptions. No Renewal Date.
Everything on this page, on your charts, for one payment. There is no second invoice, because there is no second invoice to send.
CSI ProComplete package, both indicators
- Both indicators on your charts: the overlay with the rated BUY and SELL labels, and the Confluence Pane
- The live 26-row panel and 24 alert conditions across the two
- Complete owner's manual and Quick Installation Guide
- Every future update at no extra cost. TradingView® serves the current build to your account, so there is nothing to download and nothing to re-buy
- Human help by email through the Support Hub
LuxAlgo’s Ultimate tier lists at $119.99 a month on monthly billing, which is $1,439.88 a year, every year. TrendSpider’s entry plan, Standard, lists at $82 a month, billed for as long as you keep using it. You pay for CSI Pro one time. Their invoice comes back every month. Yours does not come back at all.
Competitor prices as listed August 2026. Read from luxalgo.com/pricing and trendspider.com/pricing; competitor prices verified 2026-08-28 at the recurring monthly rate. Both were running promotional first-payment discounts on that date, which we have deliberately not used here.Paid once, then never again. No subscription, no recurring fee, no renewal date, and no other charges of any kind.
Access guarantee. If we can’t deliver access to CSI Pro on your TradingView® account, you get your money back. Email support@frontieralgo.com first. Usually it’s a mistyped TradingView® username and it takes about two minutes to sort out.
Past that, all sales are final. What you get: CSI Pro on TradingView®, the full training materials, every future update at no extra cost, and human help by email through our Support Hub. No indicator can promise you a profitable trade, and we do not. Full terms: Sales & Refund Policy.
Tomorrow Morning, The Scoring Is Already Done
You will either pull up the same crowded chart and referee the same argument, or you will open one where the evidence is already weighed, the label is already placed, and the rating already tells you which setups carry weight and which you can skip without a second thought.
- Complete checkout at Whop®, our Merchant of Record. SSL encrypted, and no card is kept on file afterward.
- Open the product in your Whop® dashboard and enter your exact TradingView® username, which is case-sensitive. Click Set, then Claim Indicators.
- Open TradingView® and go to Indicators, then Invite-Only. Both indicators appear there and the labels start printing on your charts. Refresh if they do not show up right away.
One payment. No subscriptions. No renewal date. No card kept on file. Nothing to cancel.
Educational and analytical tool only. Trading involves substantial risk of loss. Past performance is not indicative of future results. Results are not guaranteed and vary by individual.
Important Risk Disclosure
CFTC RULE 4.41: HYPOTHETICAL OR SIMULATED PERFORMANCE RESULTS HAVE CERTAIN LIMITATIONS. Unlike an actual performance record, simulated results do not represent actual trading. Also, since the trades have not been executed, the results may have under- or over-compensated for the impact, if any, of certain market factors such as lack of liquidity. Simulated trading programs in general are also subject to the fact that they are designed with the benefit of hindsight. No representation is being made that any account will or is likely to achieve profit or losses similar to those shown.
CONFLUENCE SCORE DISCLOSURE: The confidence ratings displayed by CSI Pro (HIGH, MEDIUM, LOW) represent the degree of agreement among multiple technical-analysis factors within the system. These ratings do NOT represent win rates, success rates, or the probability of profit. A HIGH rating means more of the system’s analytical criteria agree on direction, not that you have a probability advantage in dollars. All trades carry risk regardless of confidence rating.
THIS IS NOT FINANCIAL ADVICE. CSI Pro and all associated materials are provided for informational and educational purposes only. Nothing herein constitutes investment advice, a solicitation, recommendation, or offer to buy or sell any securities or financial instruments. We are not registered investment advisors. Trading involves substantial risk of loss. You may lose more than your initial investment. Consult with a qualified financial advisor before making any investment decisions.
RETAILER DISCLOSURE: This product does not provide any guarantee of income or success. Results achieved by the product owner or any other individuals mentioned are not indicative of future success or earnings. This website is not affiliated with Facebook or any of its associated entities. All content on this website, including but not limited to text, images, and multimedia, is protected by copyright law and the Digital Millennium Copyright Act. Unauthorized copying, duplication, modification, or theft, whether intentional or unintentional, is strictly prohibited.
WHOP MERCHANT-OF-RECORD DISCLOSURE: Whop serves as the Merchant of Record for the products featured on this site. Whop® is a registered trademark of Whop, Inc. and is used with permission. As the Merchant of Record, Whop is responsible for payment processing, sales-tax collection and remittance, and customer billing. The role of Whop as a Merchant of Record does not constitute an endorsement, approval, or review of these products or any claims, statements, or opinions used in their promotion.
All trading decisions are made at your own risk. See our full Risk Disclosure, Disclaimers & Privacy Policy.