
AI that draws on your chart. Not chats.
Throw Away Your Channel Indicator.The AI Draws This One.
Works on ANY Symbol, in nearly EVERY Timeframe.Stocks, futures, forex, crypto, indices, commodities. Seconds to monthly.
A TradingView indicator that draws your support and resistance channel for you, then redraws the whole thing on every bar. No period, no length, no multiplier, nothing to tune on any market. And it plots each band one bar ahead, so your level is on the chart before the candle prints.
Ahead on the chart, not ahead of the market.
Read the chart first. one BUY and one SELL at full size
- Six bands: three above, three below
- Every band drawn one bar ahead
- Redrawn every bar, on its own
- Nothing to set on any market
- Seven pivot zones, drawn each session
- Session high, low and intraday VWAP
- Every level rounded to your tick
- Wider in a spike, tighter in a squeeze
- Candles brighten as a move gets stronger
- It adapts. It does not forecast.
- Load it and it is already working
 Invite-Only Pine Script™ v6 · Two Indicators
Risk disclosure: AI Channel Trader Pro is a technical-analysis indicator, not a trade-recommendation service and not financial advice. Trading involves substantial risk of loss. Past performance does not guarantee future results.
The Proof
Look at the Right Edge of This Chart.
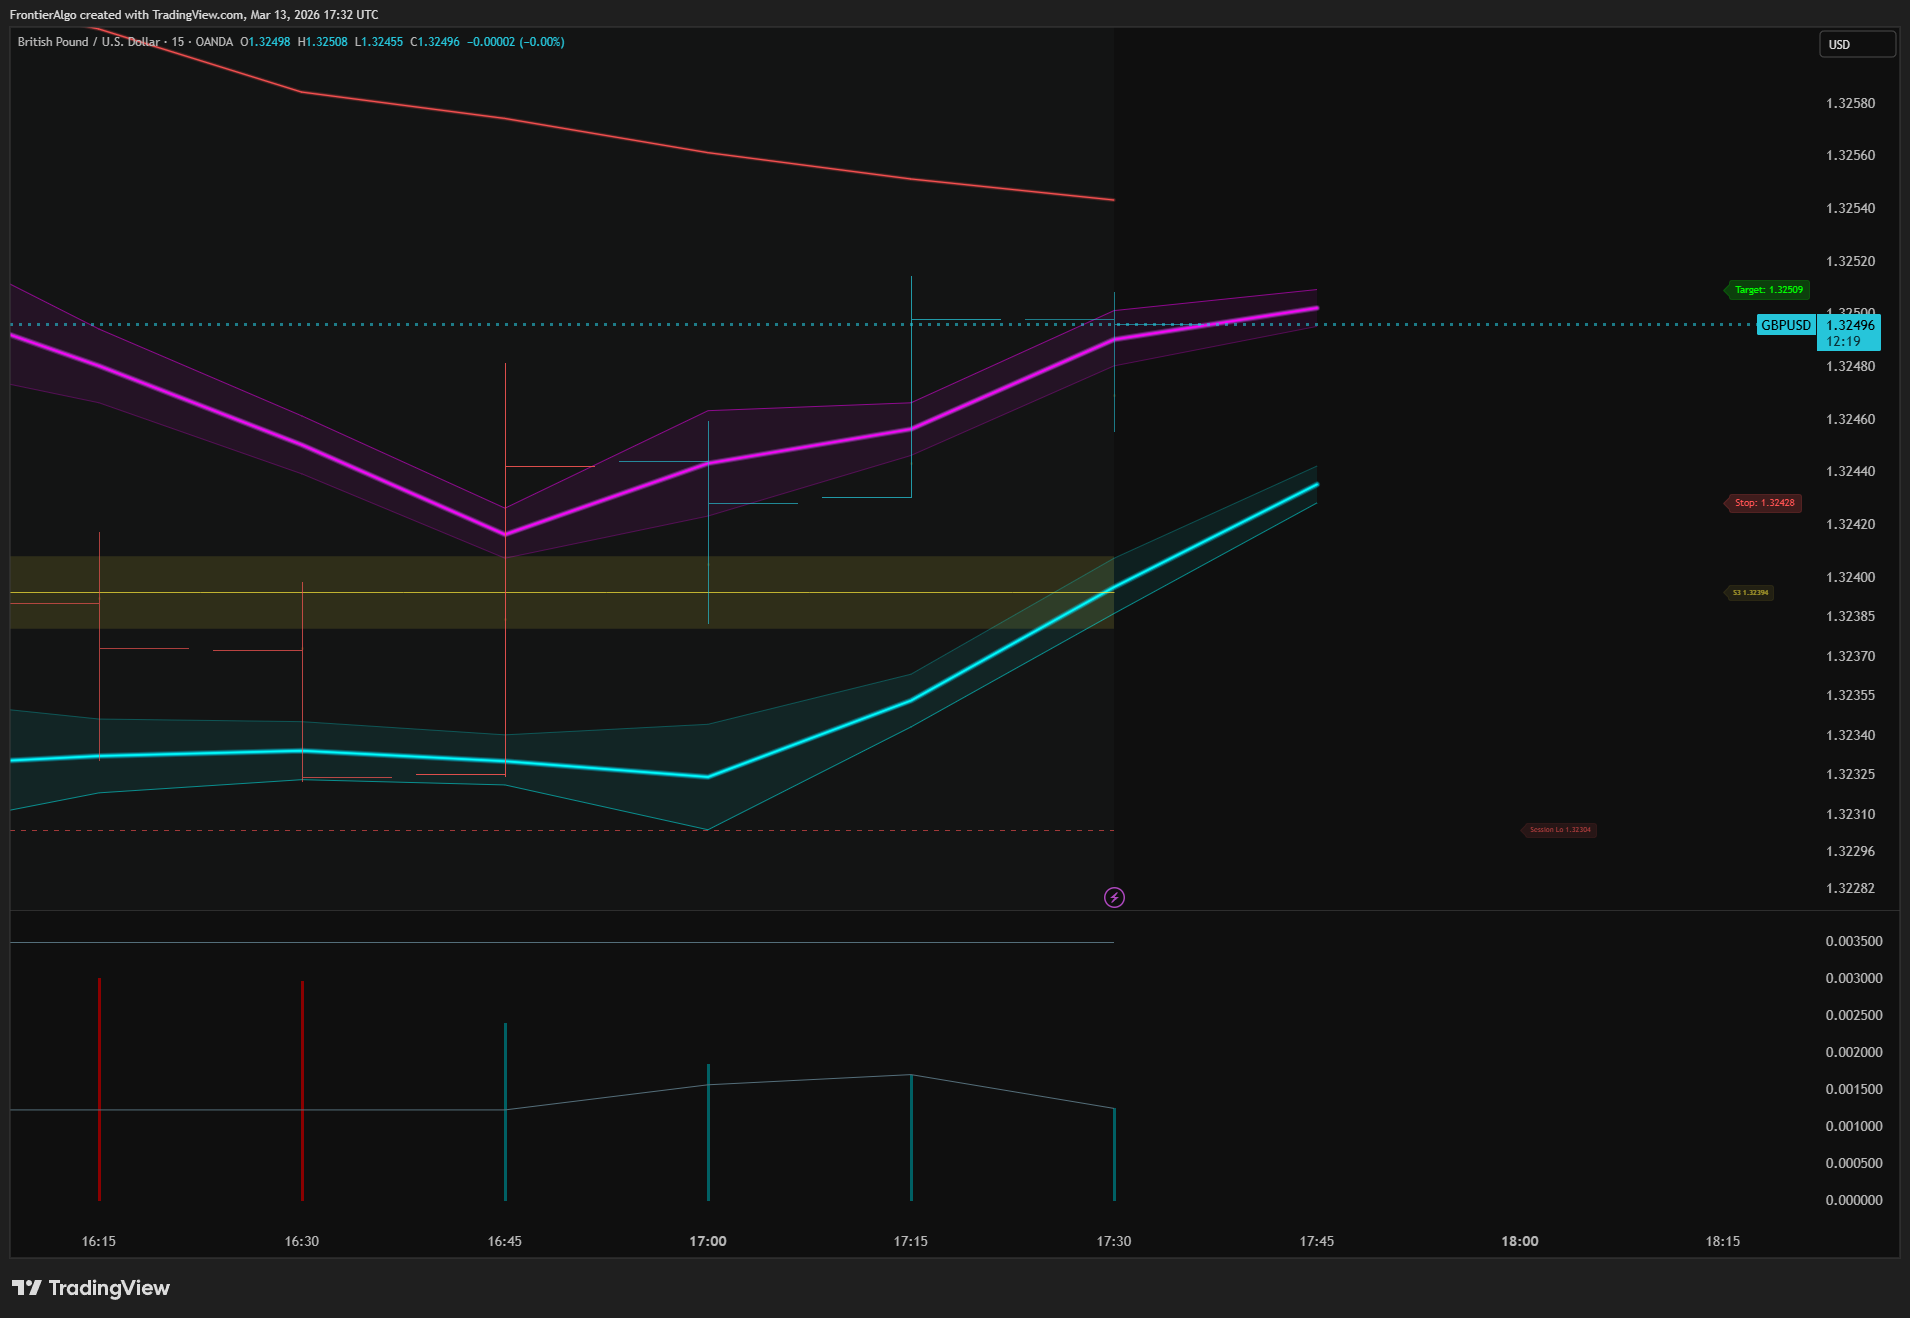
Cable, 15-minute. The screenshot was taken at 17:32 UTC. The last candle closed at 17:30. The magenta and cyan walls already run out to 17:45, across empty chart space. That bar has not printed yet. Its support and resistance are already drawn.
Hypothetical/historical example. CFTC Rule 4.41: results shown are based on historical data and do not represent actual trading. Past performance does not indicate future results.
Six bands, each carrying a one-bar forward offset. You rest a limit order on a level that is already on the screen, instead of drawing one after the candle has told you where it went.
Forward displacement is a plotting behavior, not a forecast. The bands recalibrate as price moves, and the engine adapts to conditions rather than predicting them.
We Built This Because of Sunday Night.
Every Sunday, the same ritual. Open the charts. Re-optimize five indicators for a week that had not started yet. Write the numbers down like they meant something.
Monday opened with a different range. By 10:00 the numbers were wrong again.
The tools were not broken. They were static. A static setting is a guess about a market that has not happened yet.
So we built an engine that redoes the guess on every bar, and shipped it as two invite-only TradingView indicators.
The Setting That Was Right Yesterday
One enemy, five faces. A number you typed into a dialog box on Tuesday is still sitting there on Friday, doing arithmetic on a market that has changed twice since.
Yesterday's calibration. Your 20-period setting was tuned for yesterday's range. This morning opened with a different one. The math still runs. It just answers a question nobody asked.
Late confirmations. By the time a moving average crosses, the move is half over. A static tool processes a squeeze and a breakout at the same speed. It does not accelerate through a trend. It does not slow through chop. It just… lags.
Spaghetti charts. Six indicators on one pane. Half of them overlap. Candles buried under the very lines meant to clarify them. You added tools to get clarity and built a wall between yourself and price.
Contradiction. RSI says overbought. MACD says bullish crossover. The channel says squeeze. Three tools, three opinions, zero read. The stack was built to reduce uncertainty. It multiplied it.
No read on strength. A standard oscillator gives two states: bullish or bearish. That is a weather report that only says "day" or "night." Strong, weak, fading, accelerating. All of it collapses into one color.
So the morning opens with a different range, and everything you configured is calibrated for a session that already ended. A setup forms. You hesitate, waiting on a confirmation from a tool that is already behind. The move runs without you. You close the laptop.
The problem is not the trader. A static number cannot move.
"I've bought premium indicators before and they didn't work."
1. Those needed you to configure them. This one has eight inputs: four toggle drawings on and off, two size the VWAP bands, one scales band spacing, and one is a reserved lookback that currently does nothing at all. Not one of them reaches the adaptive engine.
2. Those showed you what happened, not how hard. The Pulse pane reports four states: bullish expanding, bullish fading, bearish expanding, bearish fading.
3. Those were separate tools that never spoke to each other. The trend code that colors your candles is copied line for line into the oscillator, so both panes are reading one trend engine rather than two different ones.
The difference is not quality of effort. It is quality of architecture.
Introducing AI Channel Trader Pro
Here is the machinery, named out loud. Every claim below is checkable on your own chart in about a minute.
The channel is not a moving average wearing an envelope. It is rational quadratic kernel regression, a technique taken straight out of machine learning. It is recomputed on every bar, weighting recent price hardest down a decay curve that is rebuilt as the range changes.
Band spacing is not a fixed number of points. Each band sits one-eighth of the current bar's range from the last one by default. The channel breathes with the instrument, so gold and cable and the NASDAQ all get the right width without a single input from you.
Between the two walls the script draws a dotted midline, plotted at the exact midpoint of the upper and lower channel: the structure's own fair value. It is there to give a mean-reversion trade an objective reference between the walls. It is not a promise that price comes back to it.
The trend line is a true Kaufman Adaptive Moving Average: fast through a clean move, slow through chop. The candle shading is a separate measurement and we will not blur the two: it ranks how far the close sits from the script's internal SuperTrend stop line across the last 50 bars, so vivid means deep in the move and faded means hugging that line. A heatmap of conviction painted onto the candles, driven by a series you do not see rather than by the green and red line you do.
Two indicators ship together: AI Channel Trader Pro (the overlay) and AI Channel Pulse Pro (the oscillator, its own pane). Pine Script™ v6, invite-only, built by FrontierAlgo, with 20+ years designing trading tools and algorithmic systems across multiple markets.
And here is what it is not, because that matters just as much. Nothing is trained. There is no neural network, no language model and no cloud service. The kernel weights are three fixed constants written into the script, identical on your chart and on ours, on every instrument, on every bar. What adapts is the arithmetic those constants are fed, not the constants.
The engine adapts to current conditions. It does not forecast them, and no configuration of it removes market risk.
Hypothetical/historical example. CFTC Rule 4.41: results shown are based on historical data and do not represent actual trading. Past performance does not indicate future results.
One BUY. One SELL. That Is the Entry Vocabulary.
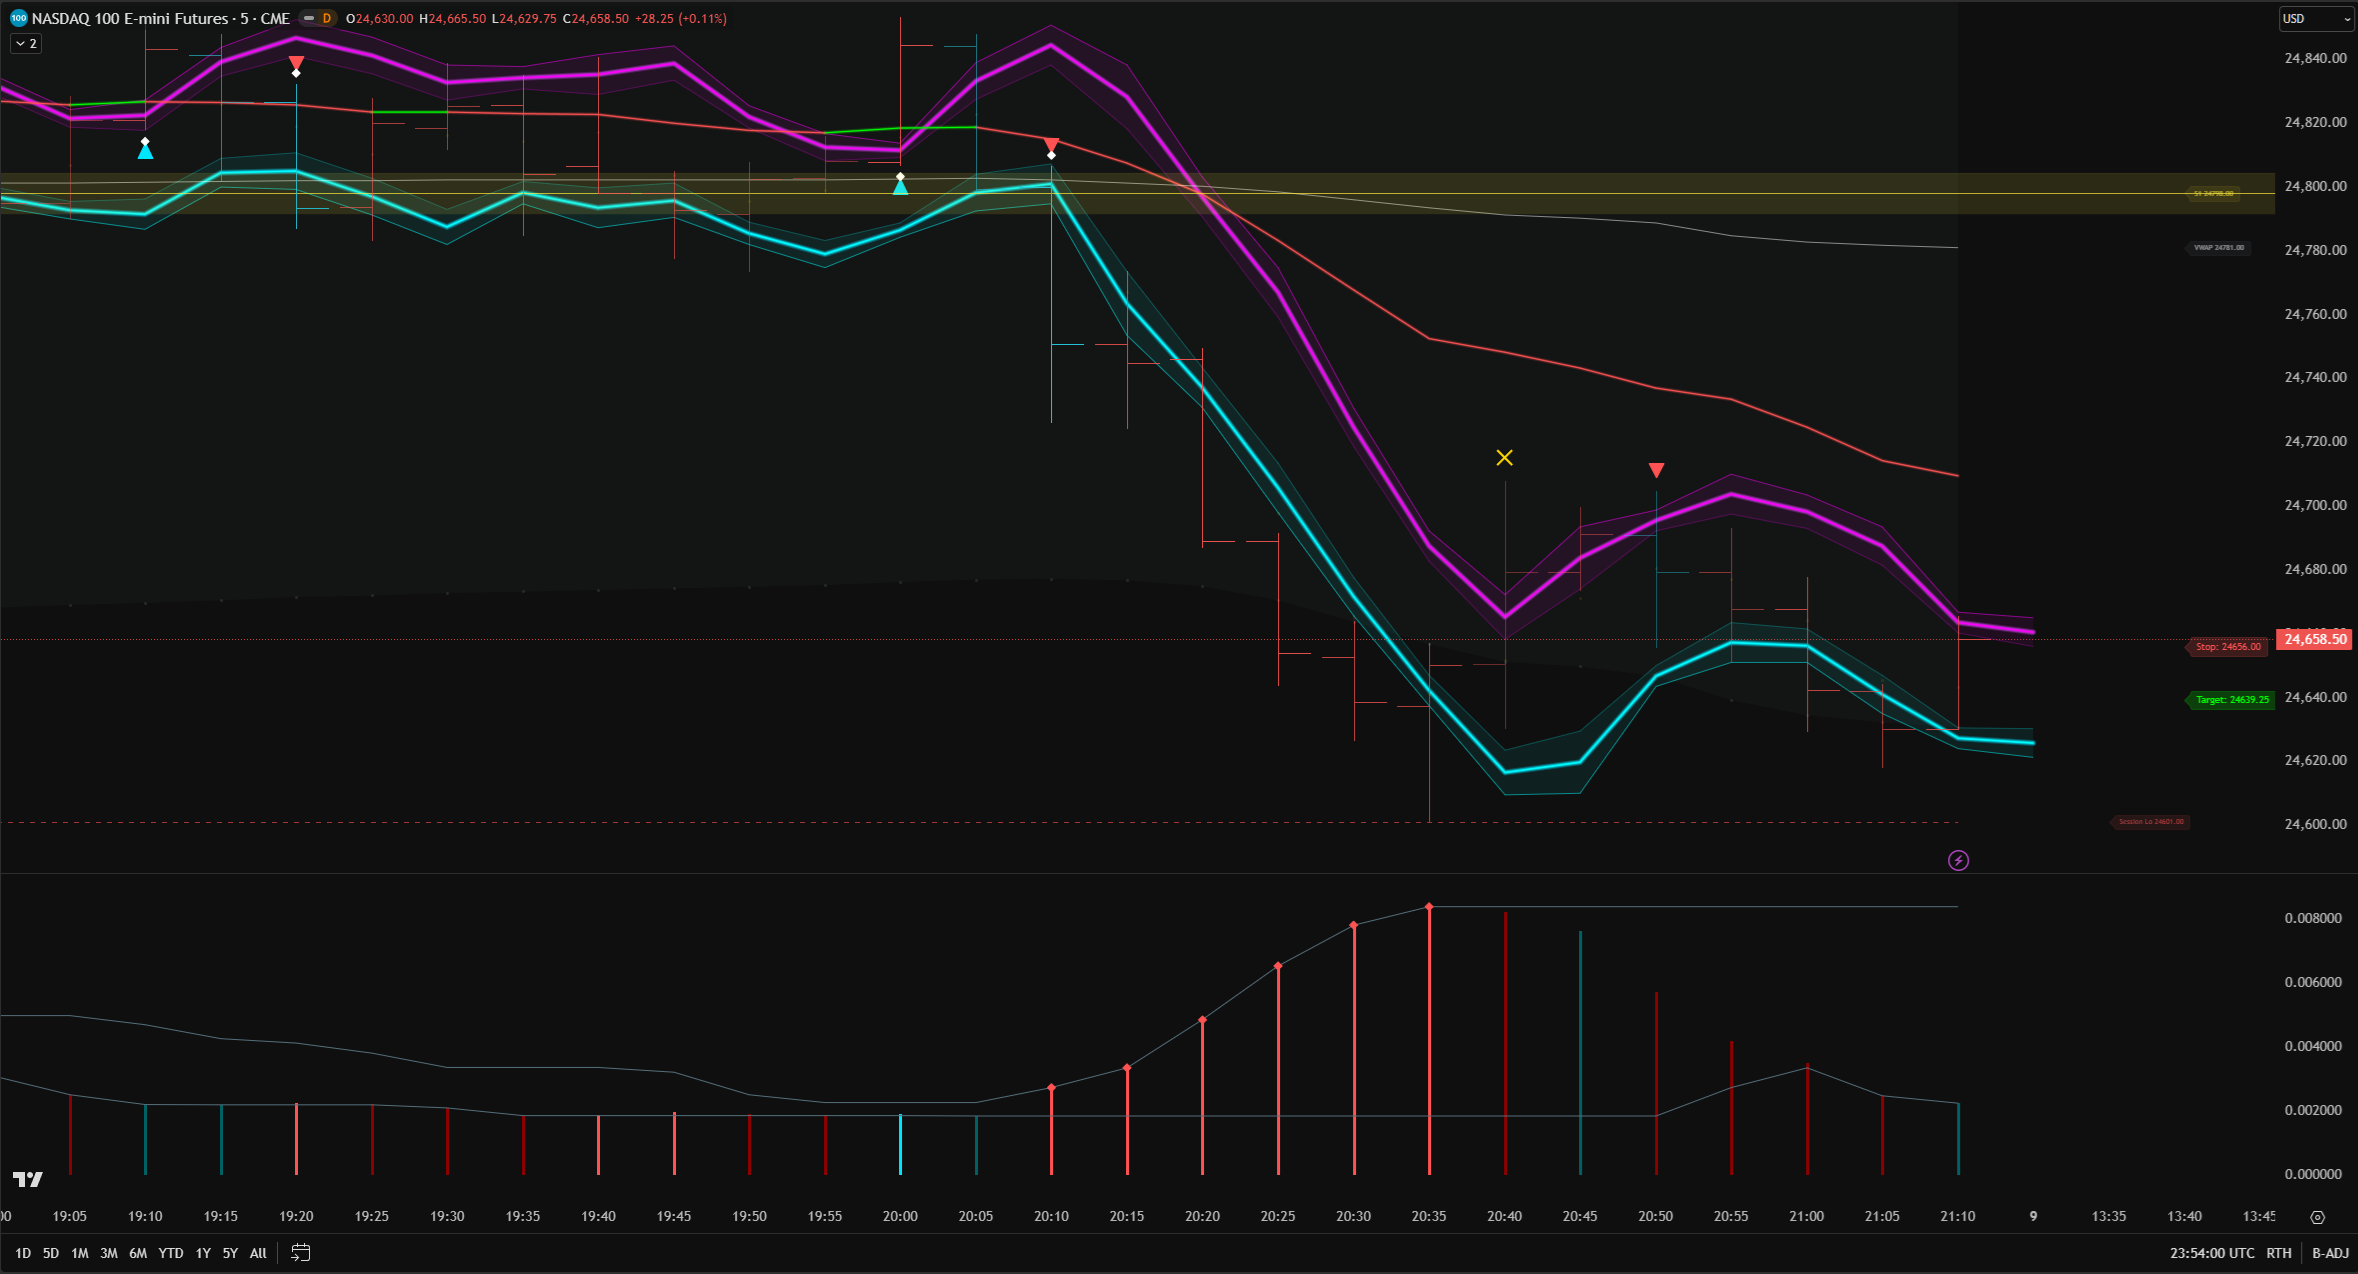
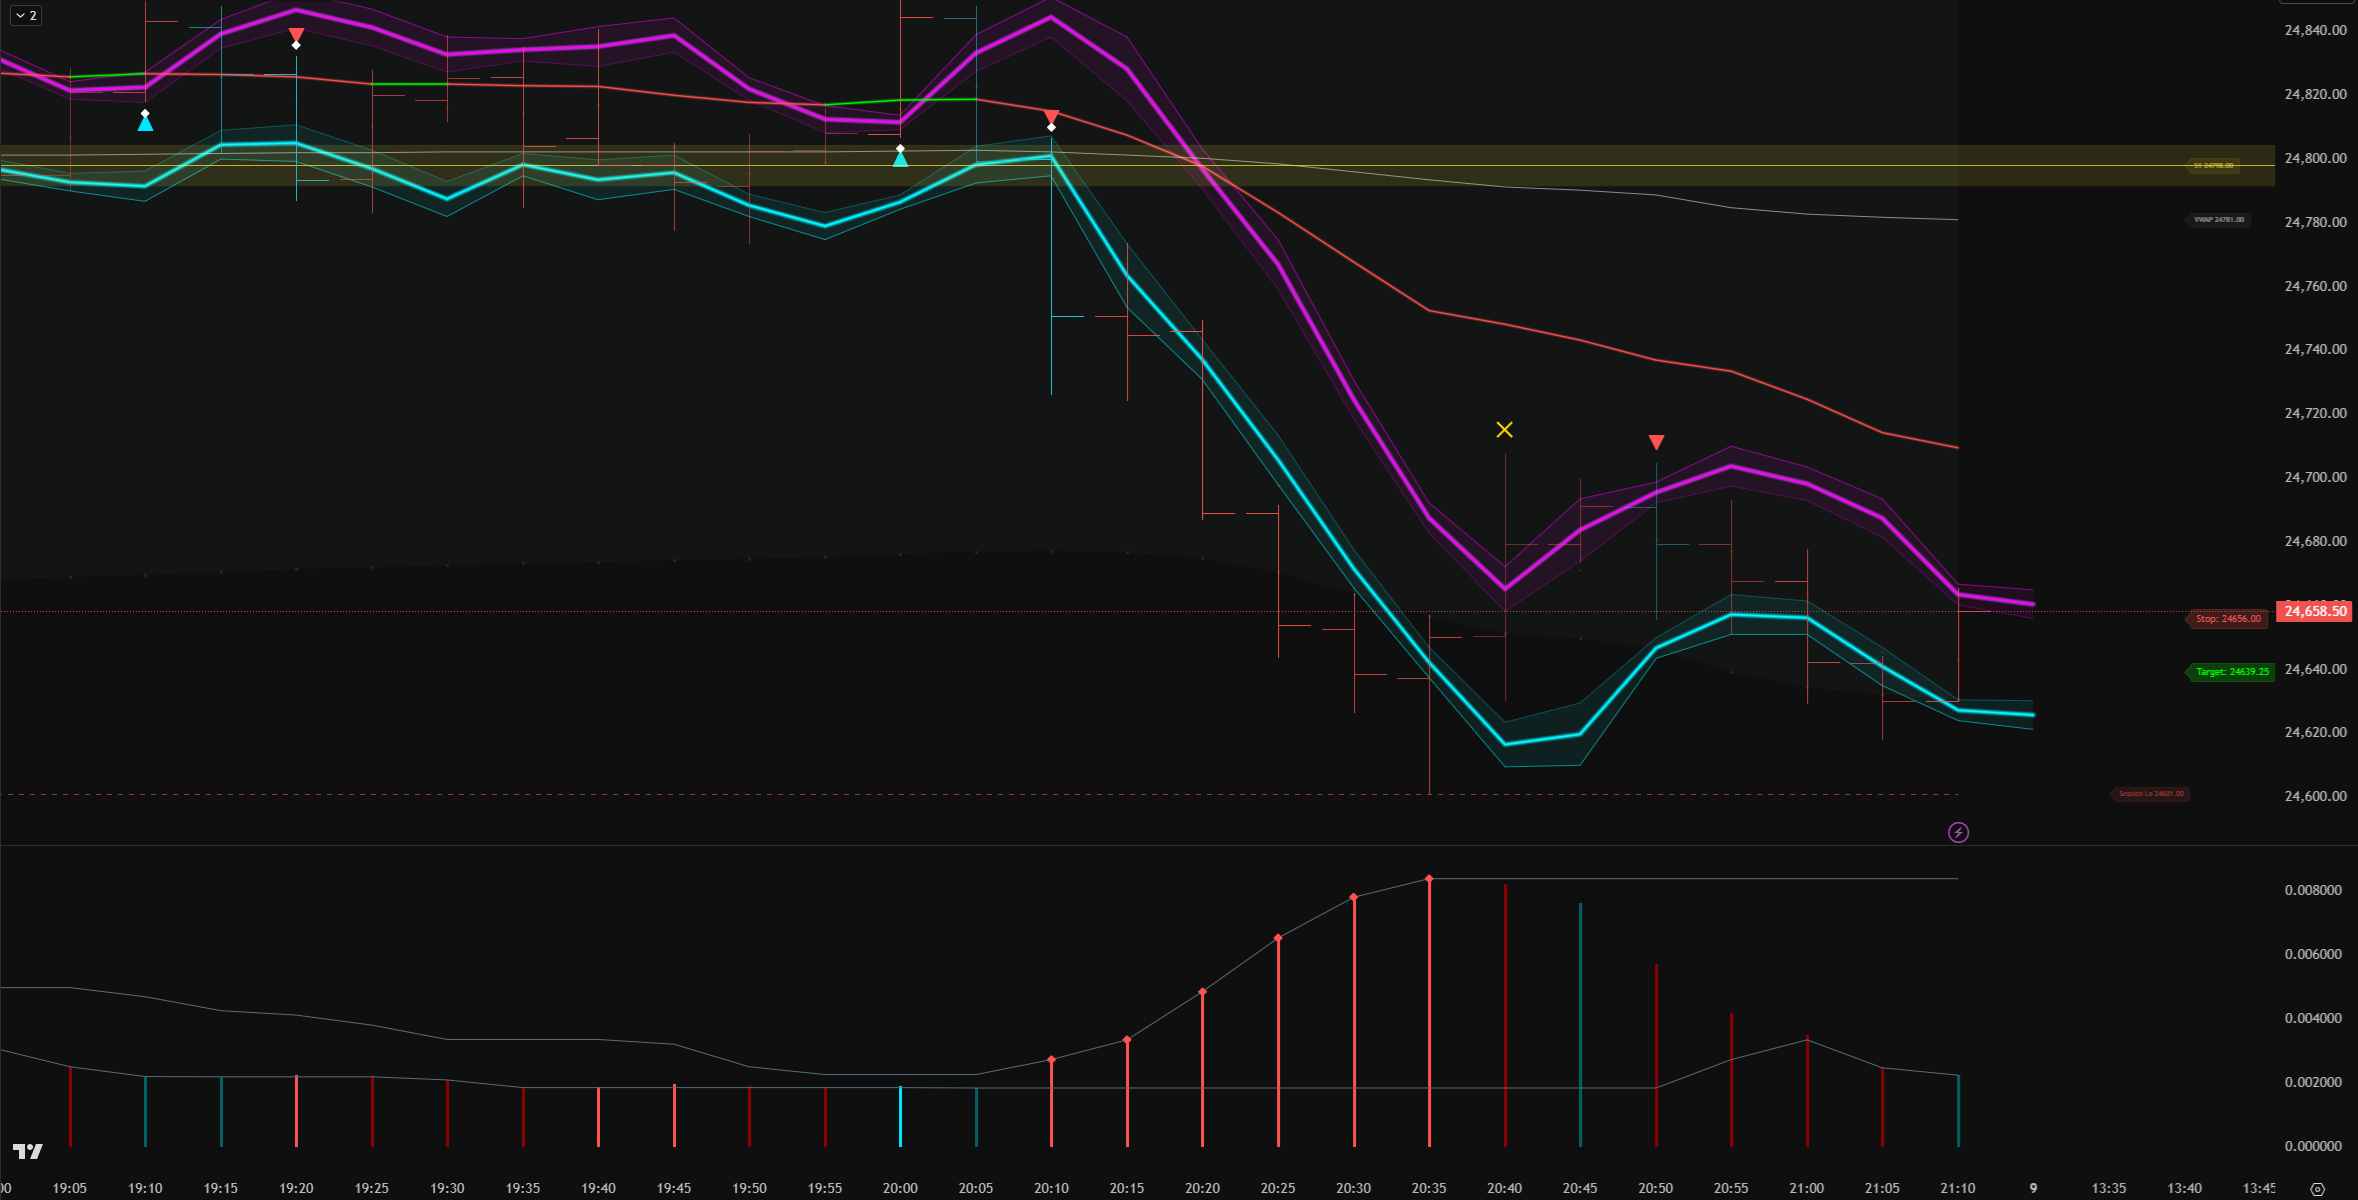
NASDAQ 100 E-mini, 5-minute. The two entry crops below are cut straight out of the chart above at full size, nothing shrunk. In each one, find the tall thin vertical line. That is a price bar. Look at what the indicator printed against it.
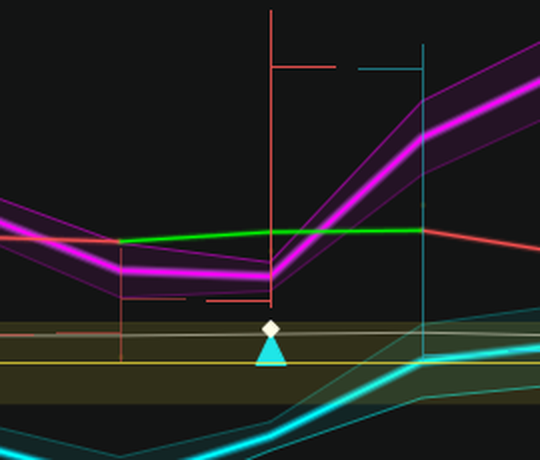
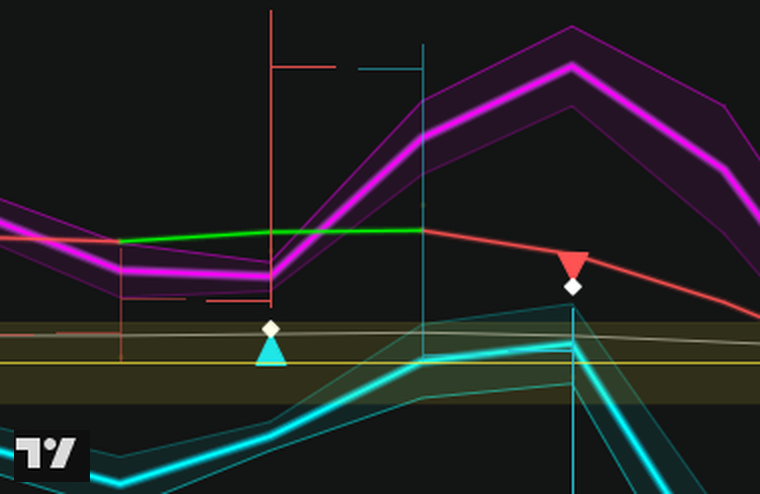
Cyan triangle, under the bar. That is a BUY.
Follow the long bar down the middle of the frame to where it ends. The white diamond sits on its low, the cyan triangle underneath. It prints only when two things land on the same bar: the trend flips bullish and the KAMA line is rising. One without the other prints nothing.
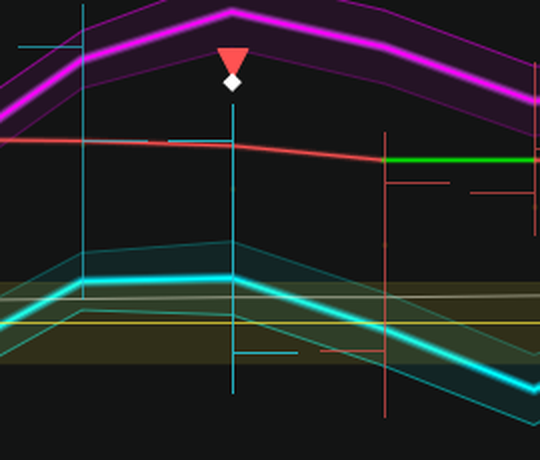
Red triangle, above the bar. That is a SELL.
Same frame logic, upside down. The bright cyan bar runs down the middle; its high is where the diamond sits, and the red triangle is printed over the top of it. The mirror condition on the short side: the trend flips bearish on a bar where the KAMA line is no longer rising.
 ▲ BUY
▼ SELL
▲ BUY
▼ SELL
Hypothetical/historical example. CFTC Rule 4.41: results shown are based on historical data and do not represent actual trading. Past performance does not indicate future results.
The two BUY and SELL tags on the chart above are our annotations for this walkthrough. The indicator draws the triangles, the diamonds, the bands and the lines, nothing else. Chart captured in TradingView.
The rest of the vocabulary
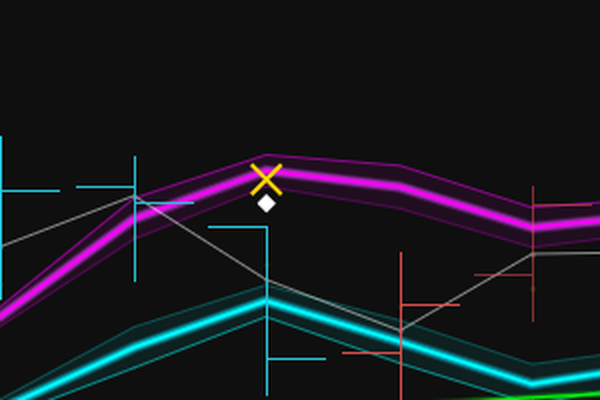
Gold X, above the bar. Trend Exhaustion.
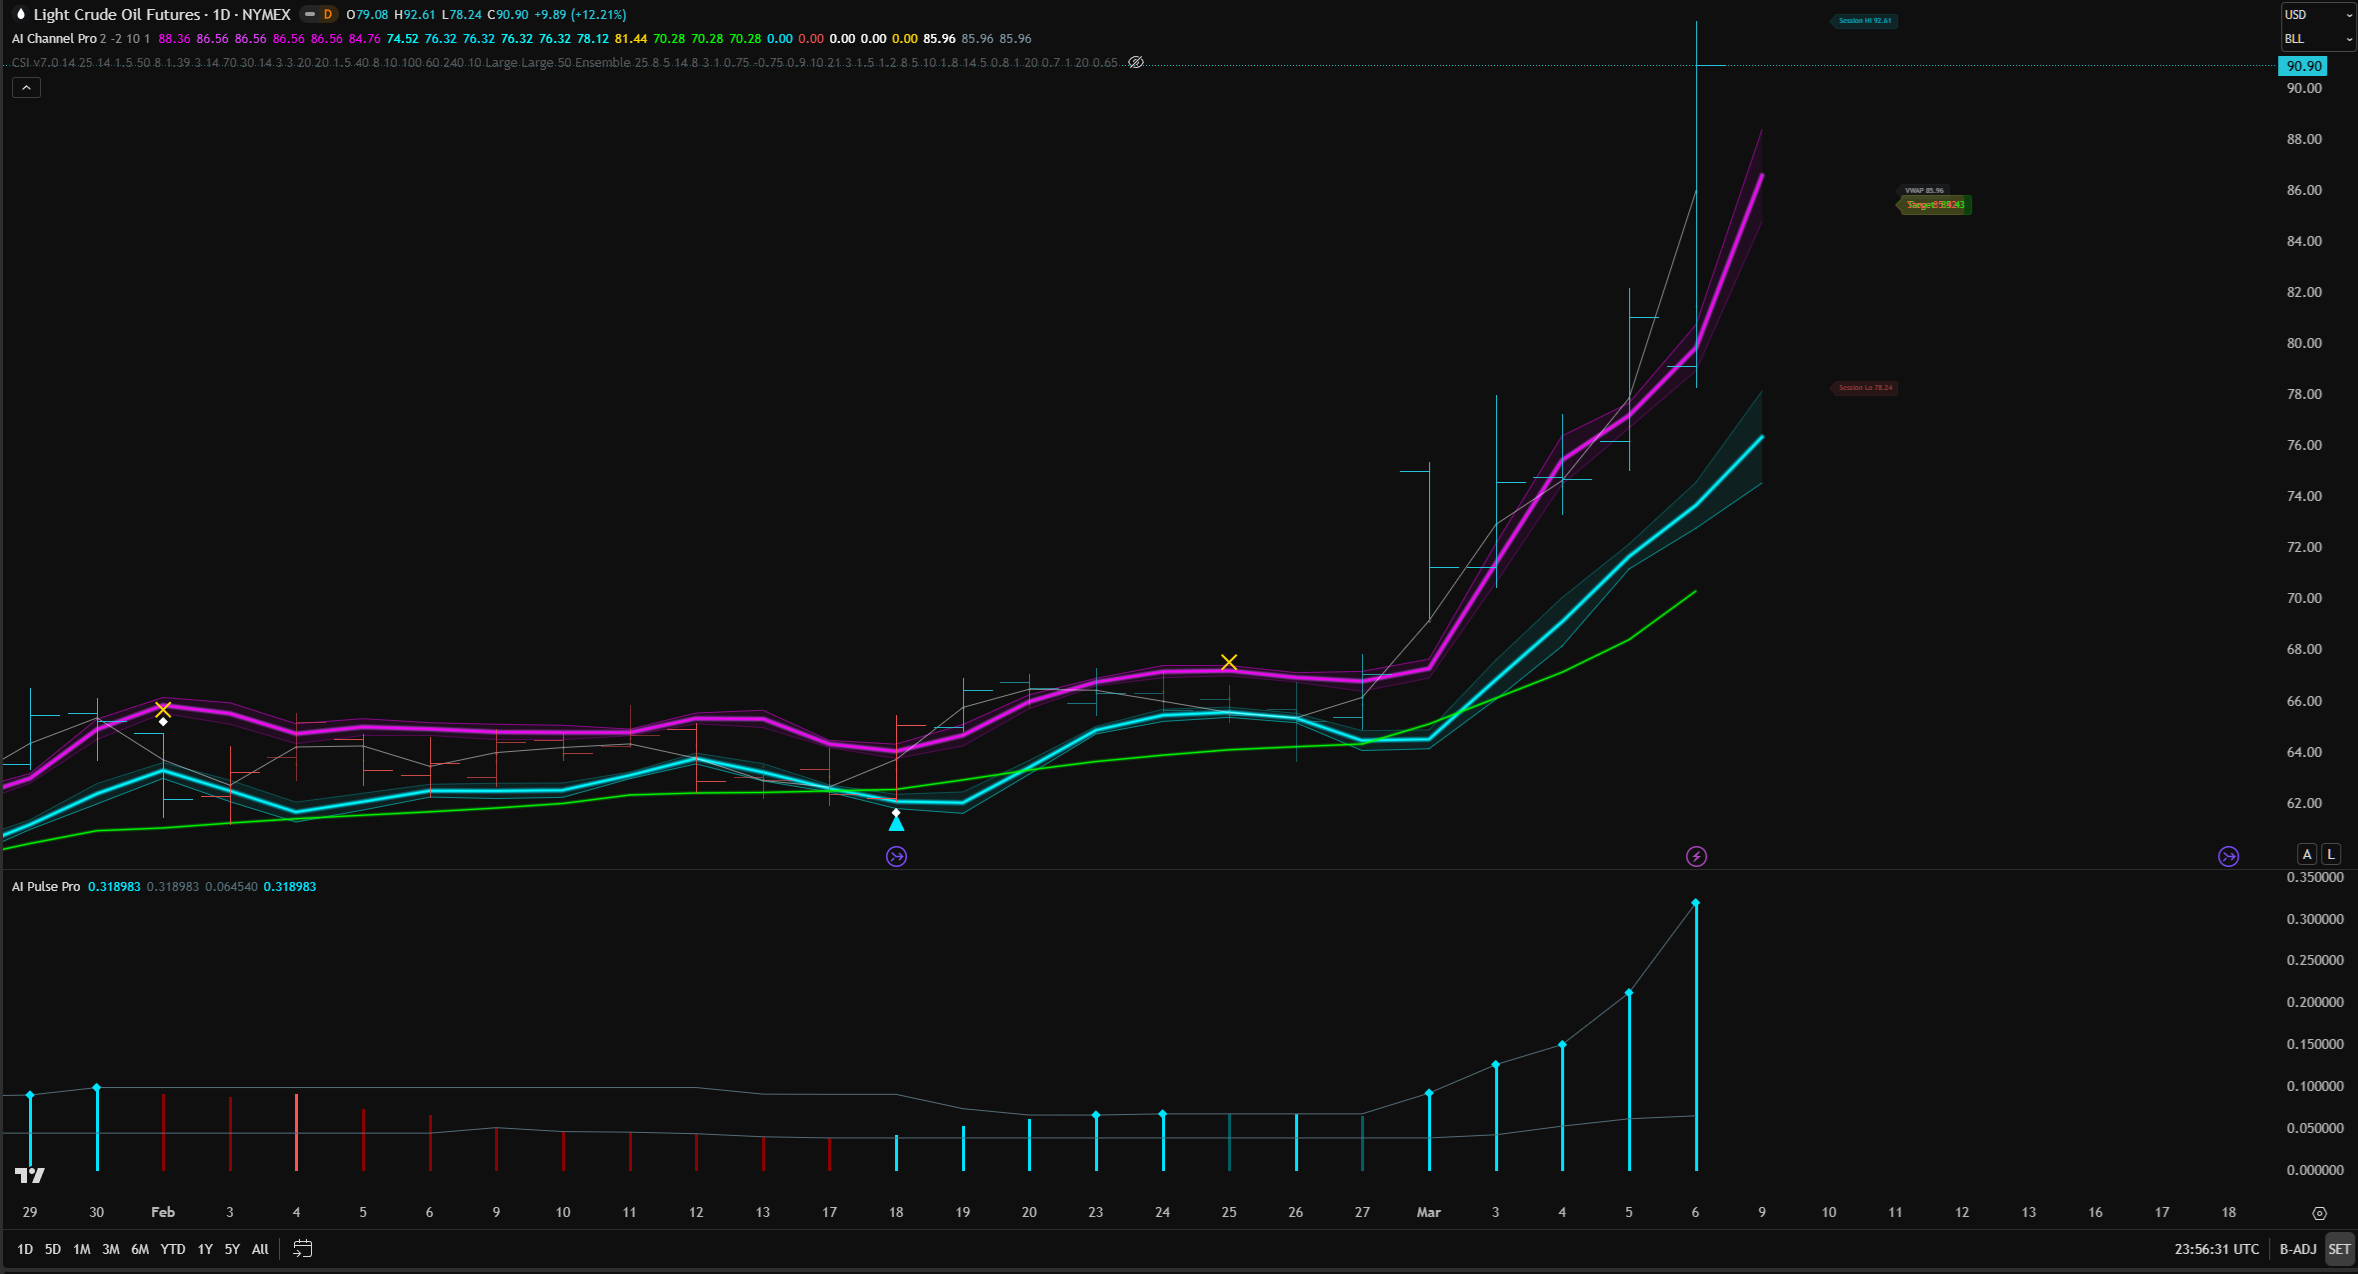
Crude Oil, daily. The X is printed over the high of the bright cyan bar in the middle. It fires after two straight bars pin the volatility ceiling and bandwidth then turns down. A heads-up that a strong move may be rolling over.
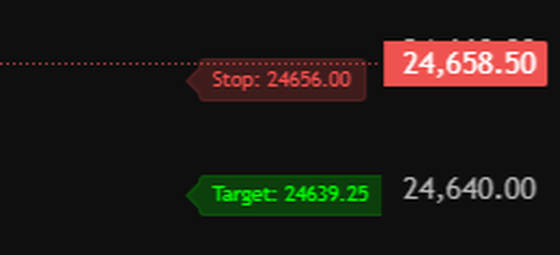
Green and red pills on the right axis.
The right-hand price axis of that same NASDAQ chart. The distance projected is the previous bar's range, measured off the current bar's low for the upside and its high for the downside, then rounded to the instrument's minimum tick, with the direction fixed at the bar's open. While price is trading inside the channel both levels are clamped to the outer walls, which is the mean-reversion case; once a bar opens outside, the target is let off the leash and the stop anchors to the wall. They print on the latest bar only, and like every live value here they move until that bar closes.
- Upper channel wall: magenta The resistance side of the six-band structure, plotted one bar ahead of price. Three magenta bands: outer, main, inner.
- Lower channel wall: cyan The support side, same three-band build, same one-bar offset. At the default width each band sits one-eighth of the bar's range from its neighbor.
- Pivot zone: the gold band across the chart A zone, not a hairline. Its half-width is one tenth of the 14-bar average true range, measured once when the session opens and held steady for that session, so you can see the area price is allowed to work inside. Seven levels per session: PP, R1 to R3, S1 to S3.
- Bar Flip: white diamond Marks a bar that closes beyond the main channel band, upper or lower, on the same bar the trend flips. Structure and direction changed together.
- Pulse pane: the histogram underneath Bar height is volatility, bar color is the trend. Four states: bullish expanding, bullish fading, bearish expanding, bearish fading.
- Midline: the dotted row of circles The midpoint between the upper and lower channel, which is the read on fair value. It is the first target when you are trading a band back toward the middle.
Cyan triangle under the bar means BUY. Red triangle above the bar means SELL. A gold X is trend exhaustion, a white diamond is a bar flip, and the green and red pills on the right axis are the Target and the Stop. That is the entire vocabulary.
These marks label what the indicator drew on the chart. They are not trade recommendations, they are not a win rate, and the decision on every one of them stays yours.
Five Things a Static Indicator Cannot Do
A five-indicator stack hands you roughly 40 parameters to babysit. The overlay ships 8 optional inputs: four on/off toggles, two VWAP band widths, one width scaler, and one reserved lookback that is wired to nothing. Not one of them reaches the engine. The oscillator ships zero.
A fixed-parameter channel you set once. Change instrument, change timeframe, and the numbers you typed stop fitting the chart.
Six bands rebuild on every bar off the kernel regression. Spacing is one-eighth of the bar's own range, so the channel widens through a volatility spike and clamps down through a squeeze on its own. Three zones of structure (outer, main, inner) instead of one line, and every level rounded to the instrument's own minimum tick so the numbers are tradable as drawn. Every band is plotted one bar ahead of price.
Two states. Bullish or bearish. A weather report that only says "day" or "night."
The histogram's height is volatility, measured as Bollinger bandwidth. Its color is the trend. Cross the two and you get four states: bullish expanding (#00E5FF), bullish fading (#006064), bearish expanding (#FF5252), bearish fading (#8B0000). You see the pressure coming out of a move while the candles are still green.
A separate VWAP script with its own settings and its own clashing color scheme, eating another indicator slot.
Session VWAP with +2.0 and −2.0 deviation bands, resetting each session, drawn inside the same visual language as everything else. It shows where execution algorithms anchor. One install, one color system, one read.
Intraday charts only, and only where the feed carries volume. On daily and higher it falls back to a two-bar average of the close, with the deviation bands flat on top of it.
Bar coloring flips between two flat shades. Up or down. Nothing about strength.
Bar intensity is a rolling 50-bar percentile rank of the distance between the close and the script's internal SuperTrend stop line, which is a different series from the trend line drawn on your chart. Vivid saturation means deep in a strong move. Washed-out pastel means hugging the line, choppy, undecided. You read trend strength off the candles without looking at a single number.
Five to fifteen adjustable parameters: period, trigger line, smoothing type. A curve-fitting minefield behind every one.
The Pulse Pro has zero user inputs. Nothing to set, nothing to overfit, nothing to get wrong. It ships two built-in alerts, Volatility Expanding and Volatility Compressing, so you do not have to build them in TradingView's condition builder. Every trader running it sees exactly the same chart.
Five instruments, one install, nothing configured between them. Go and check.
per session
trend x pressure
both on the Pulse
each bar color
What This Actually Does to Your Morning
- Open a chart cold and the structure is already drawn. Nothing to warm up, nothing to type.
- Switch from the NASDAQ to cable to gold and change nothing. The engine recalibrates itself on the first bar it sees.
- Sunday night gets shorter. There is no period, no length and no multiplier left for you to re-optimize.
- You see the pressure going out of a move while the candles are still green. Four states beat two.
- Your level is on the screen before the bar prints. Rest a limit order on it instead of chasing the close.
- Six tools collapse into one visual language. Channel, trend, VWAP, pivots, bar color, volatility.
- Your bar color and your Pulse color read one trend engine, not two. The same trend code is copied into both scripts, so the two panes are never running different logic.
- Nothing is hidden behind a score. Every input to the read is on the chart where you can argue with it.
Clearer structure is not the same thing as a better outcome. This is an analysis instrument; the trade selection, the sizing and the risk stay with you.
Five Instruments. One Engine. Zero Settings Changed.
Crude on the daily, gold through a blow-off, the euro on the 5-minute. Add the NASDAQ chart in the mechanism section and the cable chart at the top and that is five instruments, three asset classes and three timeframes, on one install with nothing reconfigured between them.
There are no testimonials on this page, and there is no win rate. Both products are only a few months old. We are not going to invent a customer, borrow a screenshot of somebody else's account, or publish a backtest statistic we cannot put a methodology behind.
What we can do is show you the indicator running on real charts, tell you exactly what every mark means, and publish the three conditions under which it behaves worst. That is the proof on offer. If you need social proof to buy, wait for it rather than take our word for anything.
Crude Oil Futures · Daily · look for: cyan BUY at the base
Consolidation through breakout
A cyan BUY triangle at the base, the KAMA line turning green under the whole advance, and a green Target pill riding the right axis. No manual adjustment anywhere in it.
Hypothetical/historical example. CFTC Rule 4.41: results shown are based on historical data and do not represent actual trading. Past performance does not indicate future results.
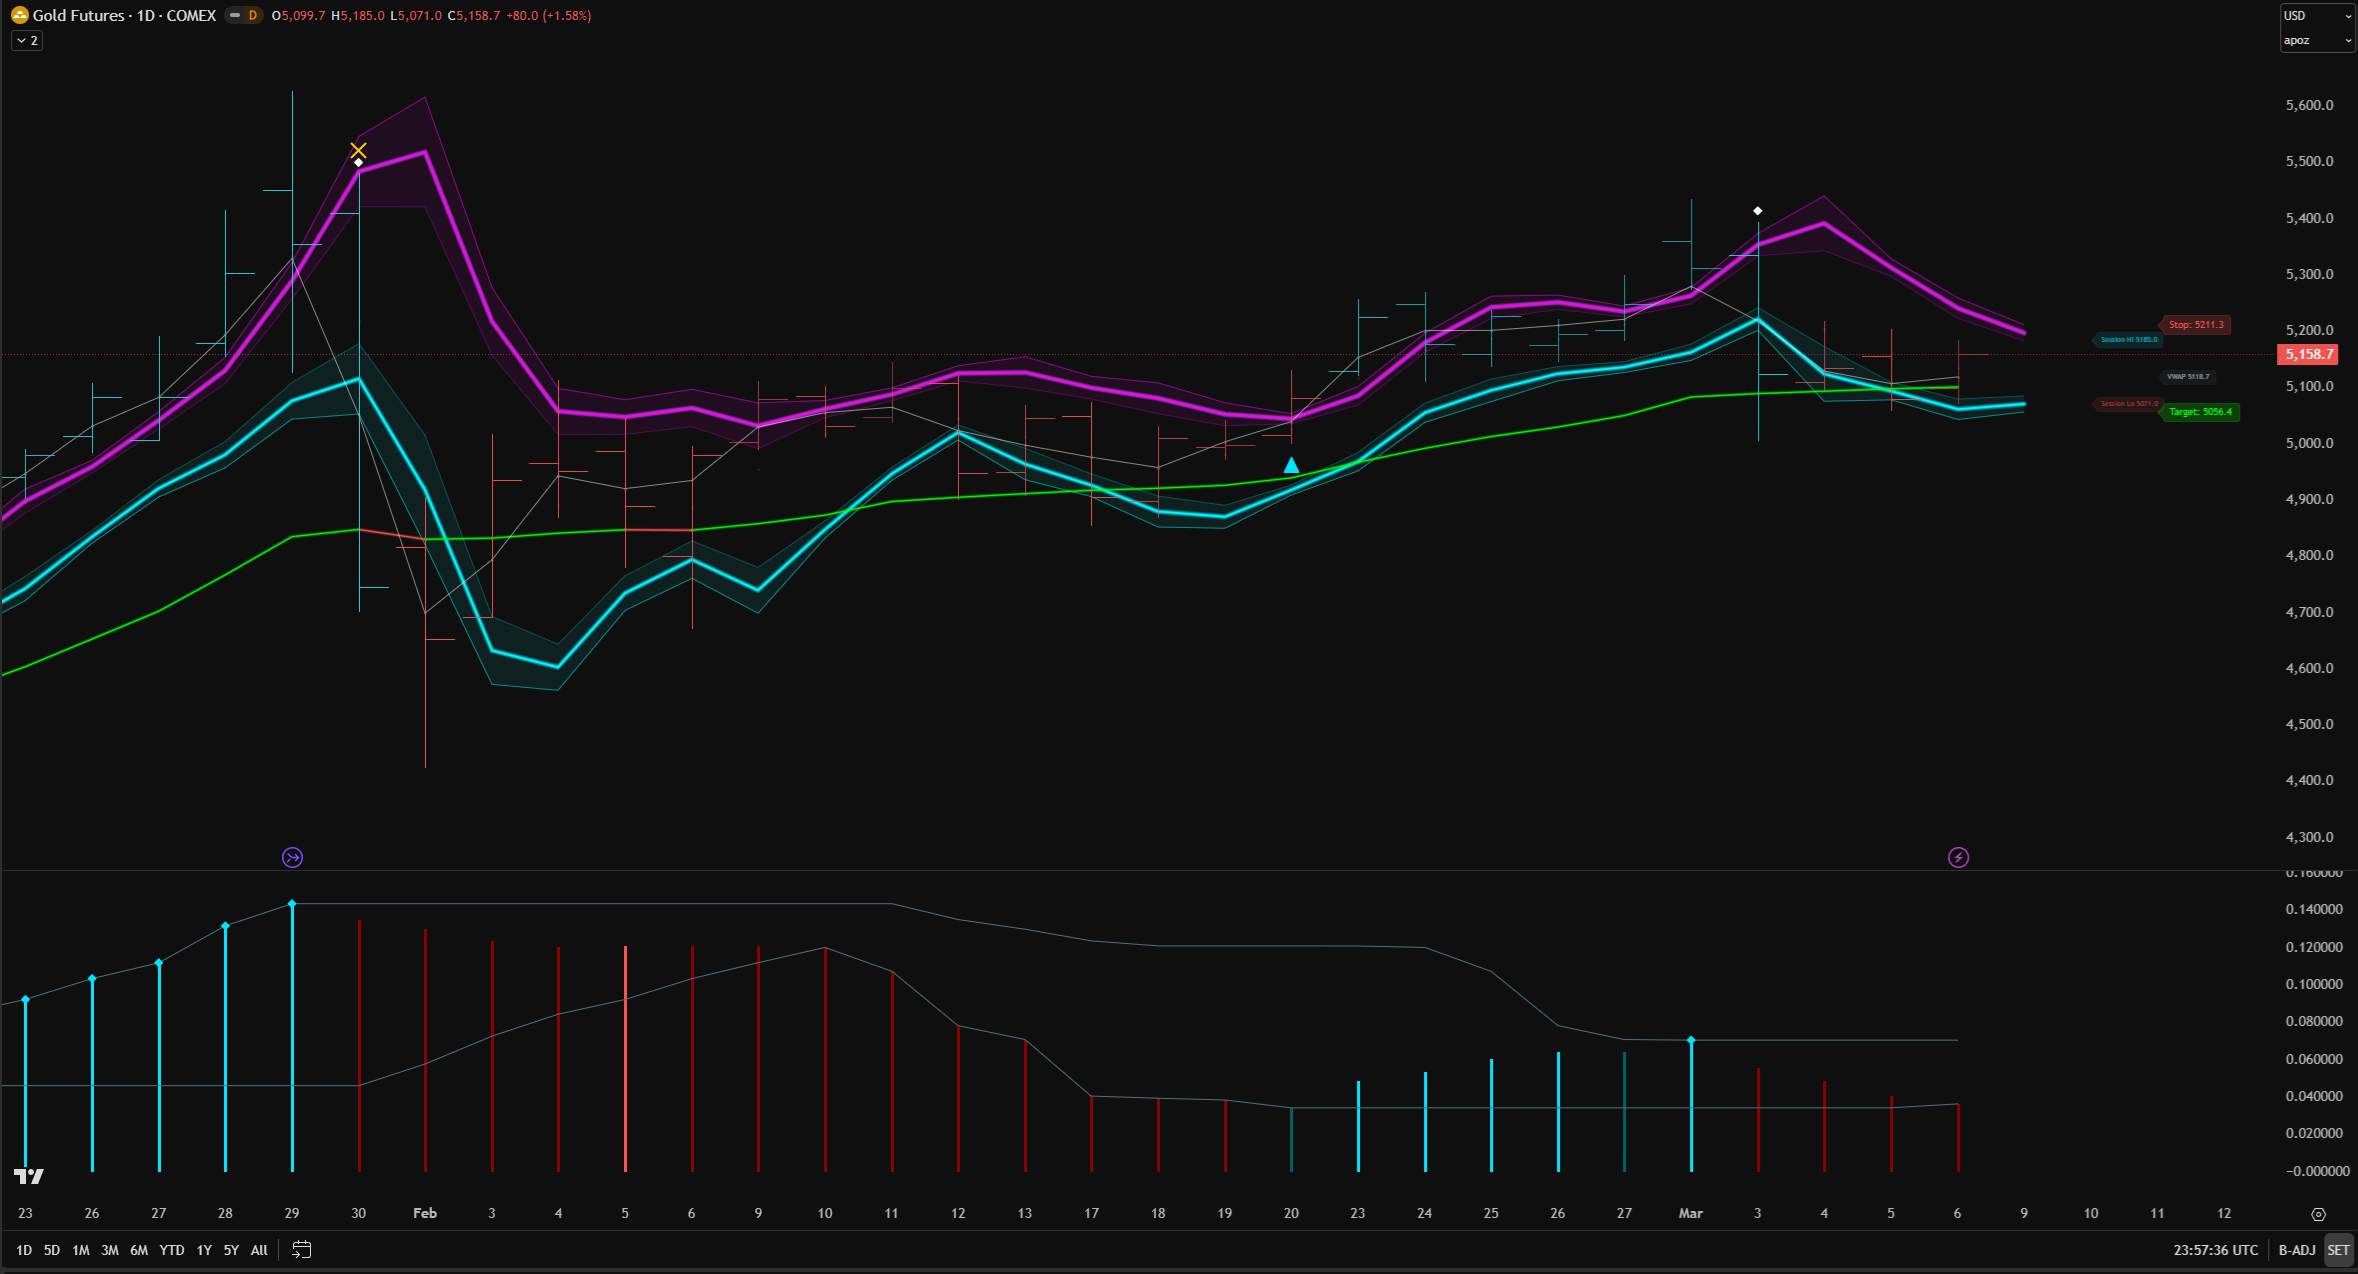
Gold Futures · Daily · look for: the channel breathing
A volatility spike, then the air going out of it
Watch the channel through the spike. It expands into the chaos, then compresses as the range dies. A gold Trend Exhaustion X sits on the blow-off top. This is the single clearest picture of what "adaptive" means in practice.
Hypothetical/historical example. CFTC Rule 4.41: results shown are based on historical data and do not represent actual trading. Past performance does not indicate future results.
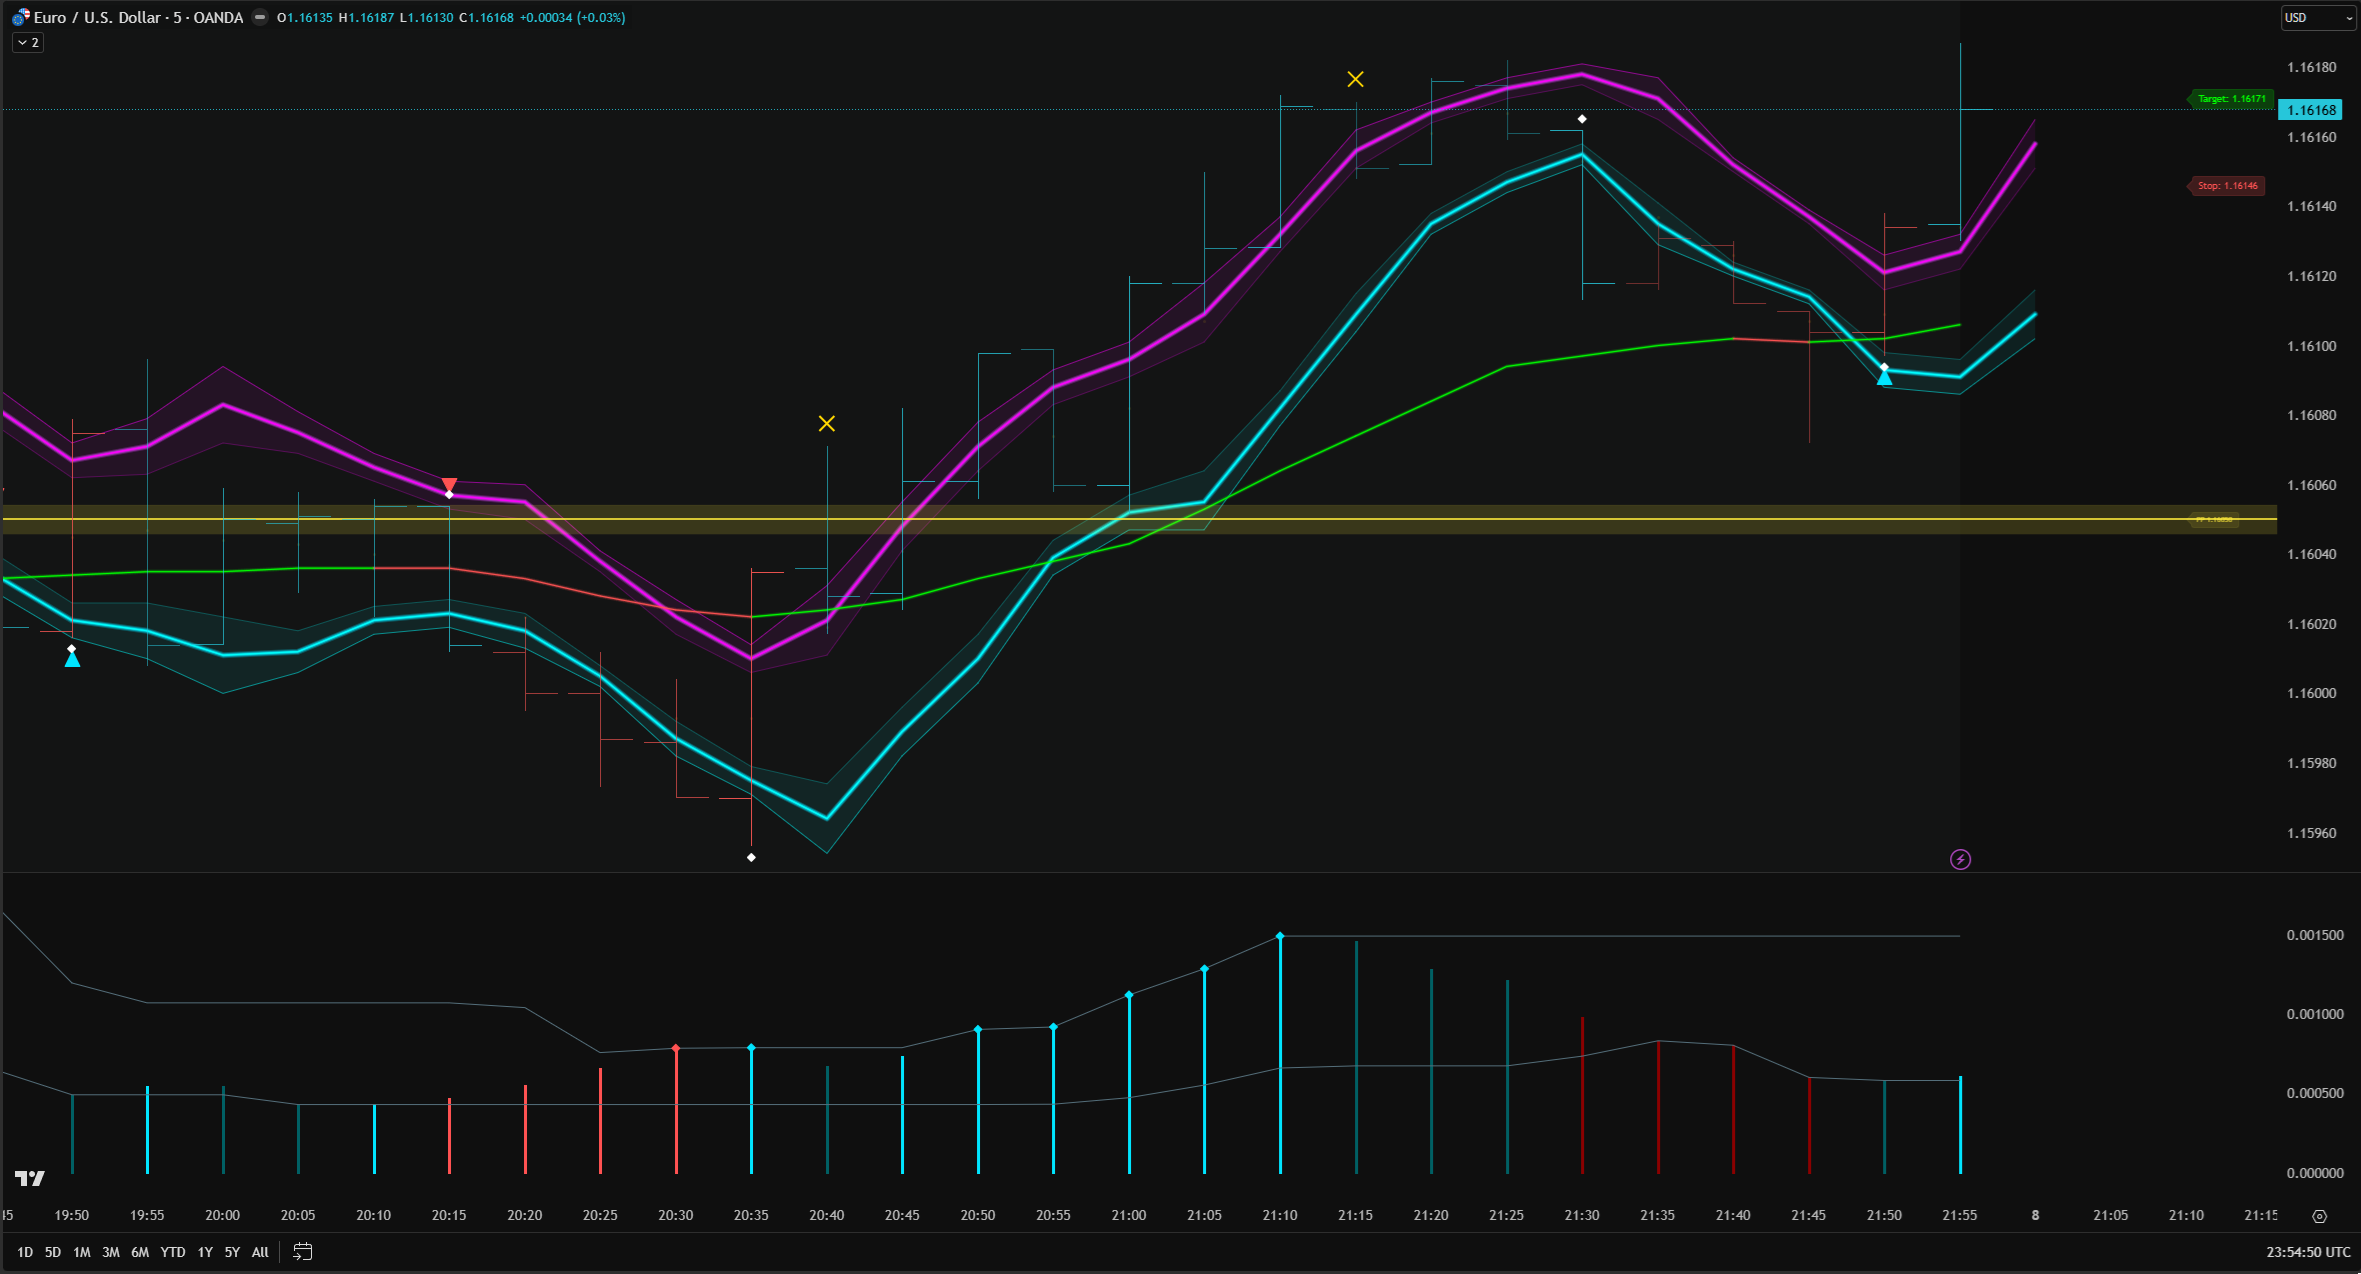
EUR/USD · 5-minute · look for: both panes at once
Everything on one screen, on a forex pair
Both scripts running together on a five-figure forex quote: six bands, the KAMA line flipping green to red, the gold pivot zone, two Trend Exhaustion crosses, BUY and SELL triangles, white Bar Flip diamonds, Target and Stop pills on the right axis, and the four-state Pulse histogram in its own pane underneath. Same install as the crude and gold charts above. Nothing was changed to move from a daily commodity chart to a 5-minute currency chart.
Hypothetical/historical example. CFTC Rule 4.41: results shown are based on historical data and do not represent actual trading. Past performance does not indicate future results.
Every element is visible on the chart. The channel adapts. The trend line reacts. The bars change color. The Pulse shifts state. You are never asked to trust a number you cannot see, because there is no number: the whole read is drawn.
An honest disclosure: we do not claim predictive capability. The engine gives a real-time structural read. It adapts to conditions, it does not forecast outcomes. And if you ever meet a vendor claiming their indicator predicts the market with certainty, that claim tells you everything you need to know about how much they respect your money.
Six Things We Publish That Most Vendors Don't
- Marks are not final until the bar closes. Every signal is computed in real time, so a triangle, a diamond or an X can appear part-way through a bar and be gone by the close. Wait for the close.
- The overlay has no built-in alerts. The only two alerts in the package are on the Pulse oscillator and both are volatility alerts, not entry alerts.
- Entry markers need two conditions on the same bar. In fast markets that can land the mark one bar after the actual inflection. That is the cost of the confirmation.
- Bar intensity is measured from an internal trend reference, not from the green and red line you can see. They usually move together. They are not the same series, so do not expect the shading to line up with that line bar for bar.
- Session VWAP needs volume, and only runs intraday. On feeds that carry no volume (a lot of spot forex) it simply does not draw, and on daily and higher it falls back to a two-bar average of the close with the deviation bands flat on top of it.
- In very low volatility the channel can go extremely narrow. That is compression showing up correctly, not a malfunction. The exhaustion mark can also misfire when bandwidth readings are very small.
We would rather you read that here than discover it on a Tuesday.
That is the whole install. Nothing above was configured.
Put Adaptive AI on My ChartsBuilt For Four Kinds of Trader. Wrong For Four.
Read both columns. The second one is the honest half, and it saves everybody a bad purchase.
Built for
✓ The Six-Indicator Chart
Built for traders who want channel, trend, VWAP, pivots, bar color and volatility speaking one visual language instead of six.
✓ The Settings Tweaker
Built for traders who have run out of patience with re-optimizing periods. Eight optional inputs, none of them inside the engine, nothing in the engine logic to curve-fit.
✓ The Multi-Market Trader
Built for traders working futures, forex and metals in one session, who would rather not keep three template files in sync.
✓ The Discretionary Trader
Built for traders who want the invalidation level drawn before they enter, and who fully intend to keep making the call themselves.
Wrong for
✗ If you want automation
Nothing here places an order, sizes a position or manages a trade. It draws. You decide. If you want a bot, this is the wrong purchase.
✗ If you are brand new to markets
Build the foundational skills first. This is an analysis instrument, not a substitute for learning how markets actually move.
✗ If you want a number to obey
There is no single score to follow. The read is spread across the channel, the trend line, the bar color and the Pulse pane, on purpose.
✗ If you want a refund window
Once your access is live, sales are final, with one exception: if we can’t deliver access to the indicator on your TradingView® account, email support and we’ll fix it or refund you in full. That covers both scripts, and it is stated here, before checkout, so nobody finds out afterward.
Exactly What Happens After You Pay
- Checkout runs on Whop, the Merchant of Record, over 256-bit SSL.
- Open the product in your Whop dashboard. Type your exact TradingView username (it is case-sensitive, so copy it from tradingview.com/u/USERNAME), click Set, then Claim Indicators.
- In TradingView, open Indicators → Invite-Only. Both scripts are waiting there: AI Channel Trader Pro and AI Channel Pulse Pro. Refresh if they are slow to appear.
- Apply both to any chart. Future updates push through TradingView automatically. No download, no reinstall, no version numbers to chase.
Access guarantee. If we can’t deliver access to the indicator on your TradingView® account, you get your money back. Email support@frontieralgo.com first. Usually it’s a mistyped TradingView username and it takes about two minutes to sort out.
Past that, all sales are final. See the refund policy for the full terms.
If anything about your purchase gives you trouble, start at the Support Hub. Human help by email is included, and most issues resolve within hours.
Access is tied to your TradingView username and is non-transferable. Whop handles payment processing, sales-tax collection and billing as Merchant of Record.
Your Questions, Answered Honestly
What moves while a bar is still forming. The six bands are computed from the current bar's own high and low, so they shift on every tick until that bar closes. The same is true of the entry triangles, the Bar Flip diamonds, the Trend Exhaustion X and the Target and Stop prices: they are calculated in real time, which means a mark can appear mid-bar and be gone before the close. They are final only at bar close. Do not act on a mark until the bar that printed it has closed. We are not going to soften that, because you will see it happen in your first live session and we would rather you heard it here.
What does not move. Closed bars are never rewritten, so nothing behind you changes. The candle color is decided at the bar's open, against the previous bar's settled trend value, so the cyan-or-red decision cannot flip on you mid-bar. The seven pivot zones are built once per session from the previous day's settled high, low and close. And the entry markers demand two agreeing conditions rather than one, which is also why, in a fast market, a marker can land a bar after the actual inflection. That is the price of the confirmation, and it is a real cost, not a feature.
The real part. The channel is built with a rational quadratic kernel, a function that comes straight out of machine learning, weighting the last three bars at 1.0, 0.667 and 0.333 down a nonlinear decay curve. The trend line is a genuine Kaufman Adaptive Moving Average: an efficiency ratio recomputed every bar blends a fast constant of 0.3333 and a slow one of 0.2222, so it speeds up in a clean move and slows through chop. Bar shading is a rolling 50-bar percentile rank. All three of those adapt to the market in front of them, and you can watch it happen: switch a chart from a trending market to a range and the channel, the trend line and the bar saturation all reshape without you touching anything.
The part that is a brand name. Nothing here is trained. There is no neural network, no language model, no cloud call and no model being fitted to your data. Those kernel weights are three constants typed into the script, and they are the same three constants on every chart, on every instrument, on every bar. "AI" describes where the math came from, not a machine that learns from you. Any vendor who will not draw that line for you is hoping you do not ask.
If an answer above reads like a dodge, email support before you buy, not after.
Rent Your Tools Monthly, or Own This Once.
Here is what the subscription route actually costs, at their own published list prices.
LuxAlgo’s Ultimate tier lists at $119.99 a month month to month, and their own annual card reads $719.88 a year. TrendSpider’s entry plan, Standard, lists at $82 a month, billed for as long as you keep using it, or $54 a month on annual billing. Competitor list prices as listed August 2026, read off their own pricing pages. Limited-time promotional discounts are excluded, because those apply to the first payment and then renew at the rates above.
| Tool | Year 1 | Year 2 | Year 3 |
|---|---|---|---|
| LuxAlgo Ultimate, monthly | $1,439.88 | $2,879.76 | $4,319.64 |
| TrendSpider Standard, monthly | $984.00 | $1,968.00 | $2,952.00 |
| AI Channel Trader Pro | $247 | $247 | $247 |
Twelve months of either subscription, even on their cheaper annual billing, still costs more than this does once. And the row that matters is the third one: it does not move. There is no year two on it.
AI Channel Trader Pro
Complete 2-Indicator System
One-time payment of $247, in full, at checkout. No subscriptions. No recurring fees. Not now, not later.
- No subscription
- No renewal date
- No card on file
- Nothing to cancel
Two indicators. One engine. One payment.
Built exclusively for TradingView®, and it runs on every plan tier including the free one. Educational and analytical tool. Trading involves substantial risk of loss. Not financial advice, and no guarantees.
Our Sales Policy
The total price is $247. There are no add-ons, no shipping, no processing surcharge and no upsell after checkout. Sales tax, where your jurisdiction requires it, is calculated and collected by Whop at checkout and shown to you before you pay.
Access guarantee. If we can’t deliver access to the indicator on your TradingView® account, you get your money back. Email support@frontieralgo.com first. Usually it’s a mistyped TradingView username and it takes about two minutes to sort out.
Past that, all sales are final. What you get: AI Channel Trader Pro on TradingView, the full training materials, every future update at no extra cost, and human help by email through our Support Hub. No indicator can promise you a profitable trade, and we don’t. See the refund policy for full details.
Merchant of Record: Whop® is the Merchant of Record for this purchase and handles payment processing, sales-tax collection and customer billing. Whop is a registered trademark of Whop, Inc. and is used with permission.
Two Versions of the Same Session
Morning One.
You open TradingView. Same chart, same five static scripts. Ten minutes go into a moving-average period that still will not be right. The bell rings. RSI says one thing, the channel says another, the oscillator is three bars behind the move. A setup forms. Or does it? You wait on a confirmation from a tool that is already late. The move runs without you.
Morning Two.
It is 9:45. You open the chart and six bands already wrap price, calibrated to this morning's range without you touching a thing. The upper wall sits at a level the market has rejected twice in the last hour. The Pulse is cyan and compressing: bullish, but fading. Price drifts back up toward the band.
You do not wait for a confirmation that arrives after the move. The level is already drawn, one bar ahead, so you rest a limit order on it and let price come to you. If the Pulse confirms the fade, you take it. If it does not, you skip it and the order never fills. Either way the decision was made before the candle, not after it.
Same market. Same price data. Entirely different level of clarity.
This scenario illustrates how the adaptive system reads, not a guaranteed trading outcome. Every trade carries risk regardless of the tools used.
P.S. The one thing this does that a free channel script cannot: it draws the next bar's support and resistance into the empty space before that bar exists. Go back and look at the right edge of the cable chart again. The candle at 17:45 had not printed. Its walls were already on the screen. To be exact about what that is: the level is computed from bars that have already happened and then plotted one bar to the right. It is a head start on where the structure sits, not a prediction of where price will go.
One Payment, In Plain Terms
AI Channel Trader Pro costs $247, one time, and that is the total price. No subscription, no renewal date, no card kept on file and nothing to cancel. Sales tax is added at checkout only where your jurisdiction requires it, and is shown before you pay. Whop is the Merchant of Record and handles payment processing, sales-tax collection and customer billing.
AI Channel Trader Pro is a technical-analysis tool for TradingView®. It is educational and analytical, it is not personalized investment advice, and trading involves substantial risk of loss. Past performance does not guarantee future results, and results are not guaranteed and will vary.
Questions before you buy: support@frontieralgo.com or the Support Hub.
Important Risk Disclosure
CFTC RULE 4.41 - HYPOTHETICAL OR SIMULATED PERFORMANCE RESULTS HAVE CERTAIN LIMITATIONS. Unlike an actual performance record, simulated results do not represent actual trading. Also, since the trades have not been executed, the results may have under-or-over compensated for the impact, if any, of certain market factors, such as lack of liquidity. Simulated trading programs in general are also subject to the fact that they are designed with the benefit of hindsight. No representation is being made that any account will or is likely to achieve profit or losses similar to those shown.
THIS IS NOT FINANCIAL ADVICE. This product and all associated materials are provided for informational and educational purposes only. Nothing herein constitutes investment advice, a solicitation, recommendation, or offer to buy or sell any securities or financial instruments. FrontierAlgo is not registered as a securities broker-dealer, investment advisor, or commodity trading advisor with the SEC, CFTC, NFA, or any state regulatory agency. Trading involves substantial risk of loss. You may lose more than your initial investment. Consult with a qualified financial advisor before making any investment decisions.
AI/ML DISCLOSURE: The AI-powered adaptive features in this product use machine-learning-inspired techniques for adaptive channel calibration, dynamic trend speed control, and volatility-normalized momentum detection. The use of adaptive technology does not guarantee profitable trading outcomes. AI-based analysis is subject to the same market uncertainties as any other analytical approach. Past algorithmic performance does not predict future results.
Disclaimer: Please note that this product does not provide any guarantee of income or success. The results achieved by the product owner or any other individuals mentioned are not indicative of future success or earnings. This website is not affiliated with Facebook or any of its associated entities. Once you navigate away from Facebook, the responsibility for the content and its usage lies solely with the user. All content on this website, including but not limited to text, images, and multimedia, is protected by copyright law and the Digital Millennium Copyright Act. Unauthorized copying, duplication, modification, or theft, whether intentional or unintentional, is strictly prohibited. Violators will be prosecuted to the fullest extent of the law.
RETAILER DISCLOSURE: Whop serves as the Merchant of Record for the products featured on this site. Whop® is a registered trademark of Whop, Inc. and is used with permission. As the Merchant of Record, Whop is responsible for payment processing, sales-tax collection and remittance, and customer billing. The role of Whop as a Merchant of Record does not constitute an endorsement, approval, or review of these products or any claims, statements, or opinions used in their promotion.
All trading decisions are made at your own risk. See our full Risk Disclosure, Disclaimers & Privacy Policy page.